Semiconductor Landscape of India is changing across North ,South ,West and East. For vast country like India climate vary a lots, thus hidden cost of running the Plant. This article tried to understand how different Climatic factors will affect the Operation Cost of running Semiconductor Plant. The Study is Based on IMD Data.
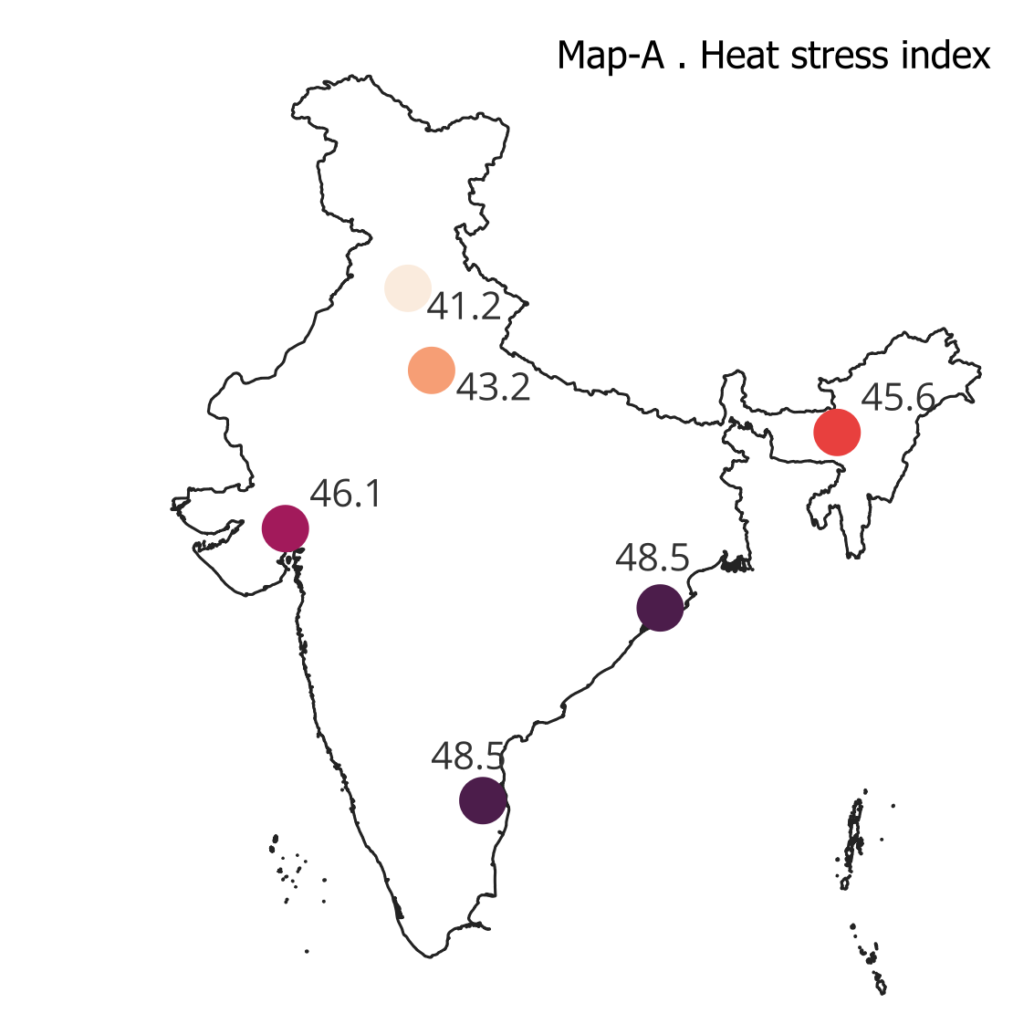
A) Heat stress index (HSI) is calculated using temperature and humidity at peak daytime conditions. higher heat index shows higher the
The map-A, shows clear spatial variation in peak daytime heat stress across india. coastal and humid stations such as Bhubaneswar and Tirupati record the highest heat stress index values (around 48.5), indicating strong combined effects of temperature and humidity. Ahmedabad also shows high heat stress (46.1), driven mainly by high temperature rather than humidity.Guwahati records moderately high heat stress (45.6), reflecting humid but relatively lower temperatures. in contrast, Chandigarh (41.2) and Jewar/western up (43.2) show lower heat stress, suggesting comparatively reduced peak cooling pressure. overall, the map highlights that heat stress is not controlled by temperature alone; humidity significantly elevates stress levels in coastal and eastern regions, increasing cooling and energy demand for industrial operations.
B) The Sensible dominance index (SDI) measures whether cooling demand is controlled more by temperature rise or by moisture in the air. it is calculated as the ratio of diurnal temperature rise (ΔT) to vapour pressure at 12 utc. higher values indicate temperature-driven (sensible) cooling dominance, while lower values indicate moisture-driven (latent) cooling dominance.
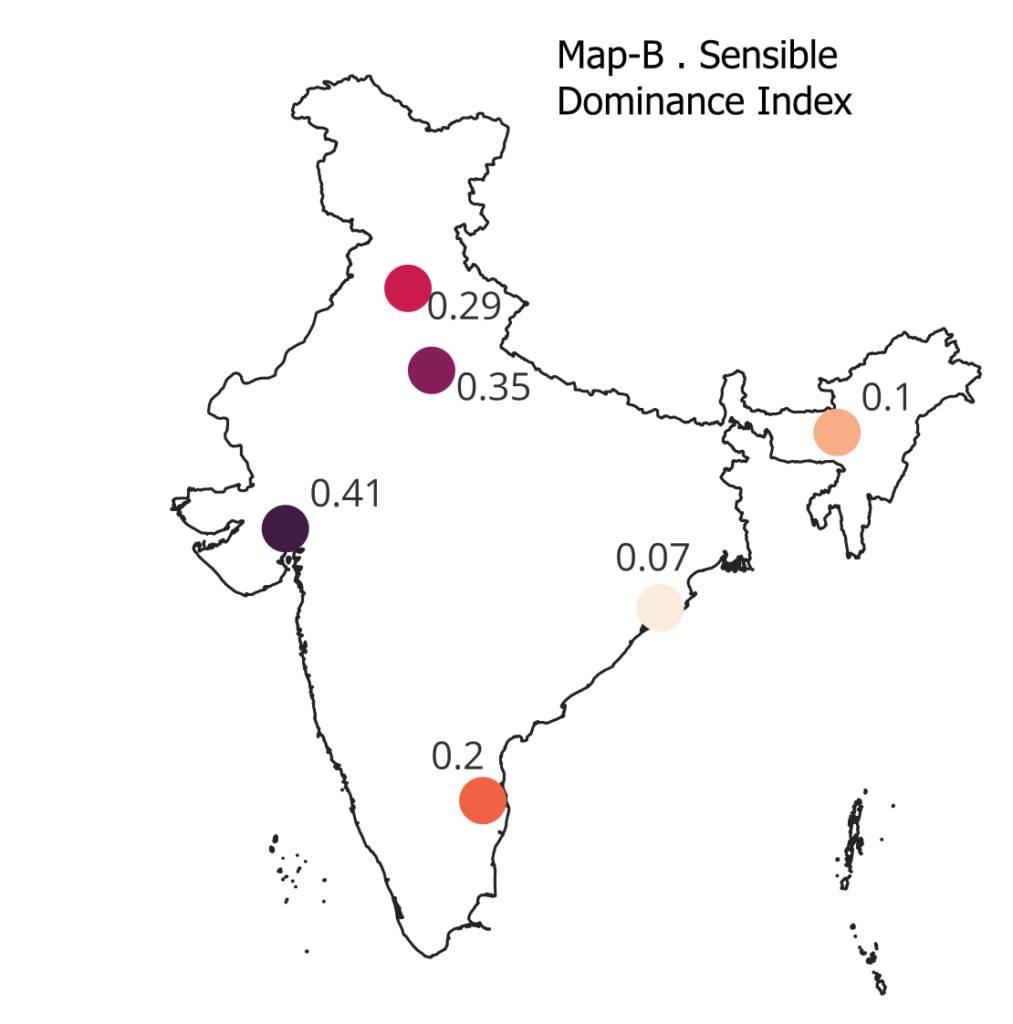
The map shows a clear west–east contrast in the nature of cooling demand across india. Ahmedabad records the highest SDI (0.41), indicating that cooling demand is strongly dominated by temperature rise rather than humidity. Jewar/western up (0.35) and Chandigarh (0.29) also show temperature-dominated cooling regimes, though less intense than ahmedabad. Tirupati (0.20) represents a mixed regime where both temperature and humidity contribute to cooling demand. in contrast, Bhubaneswar (0.07) and Guwahati (0.10) show very low SDI values, confirming that cooling demand in coastal and northeast regions is primarily driven by moisture and dehumidification rather than high temperatures. overall, the map highlights that inland regions face sensible heat–driven energy costs, while eastern and humid regions face latent cooling and humidity control challenges.
C) Extreme temperature risk measures the intensity of heat waves above normal operating conditions. it isis calculated as the difference between the extreme maximum temperature and the mean daily maximum temperature, indicating how far peak temperatures exceed routine thermal conditions.
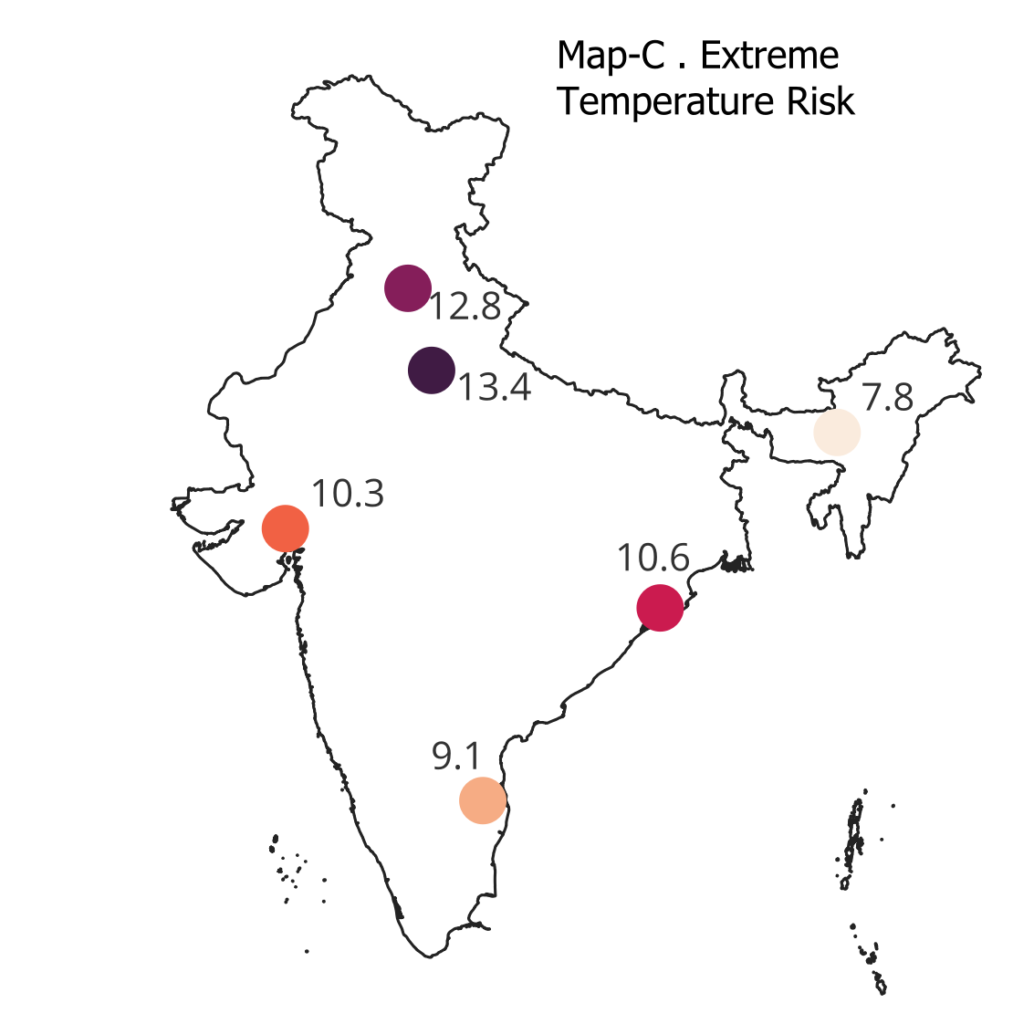
The map shows that Jewar/western up (13.4 °C) and Chandigarh (12.8 °C) experience the highest extreme temperature risk, indicating large heat-wave departures above normal daytime temperatures. Bhubaneswar (10.6 °C) and Ahmedabad (10.3 °C) also show substantial extreme risk, reflecting strong but more frequent high-temperature conditions. Tirupati (9.1 °C) records slightly lower extreme deviation, while Guwahati (7.8 °C) shows the lowest extreme temperature risk due to comparatively moderated maximum temperatures. overall, the map highlights that northern inland locations face the most severe heat-wave spikes, which increase peak cooling demand, redundancy requirements, and operational risk despite lower average temperatures in some cases.
D) Precipitation reliability (PR) measures the consistency of water availability and is calculated as the ratio of rainy days to total days in a year (PR = RD / 365). higher values indicate more reliable natural water supply, while lower values indicate water scarcity risk.
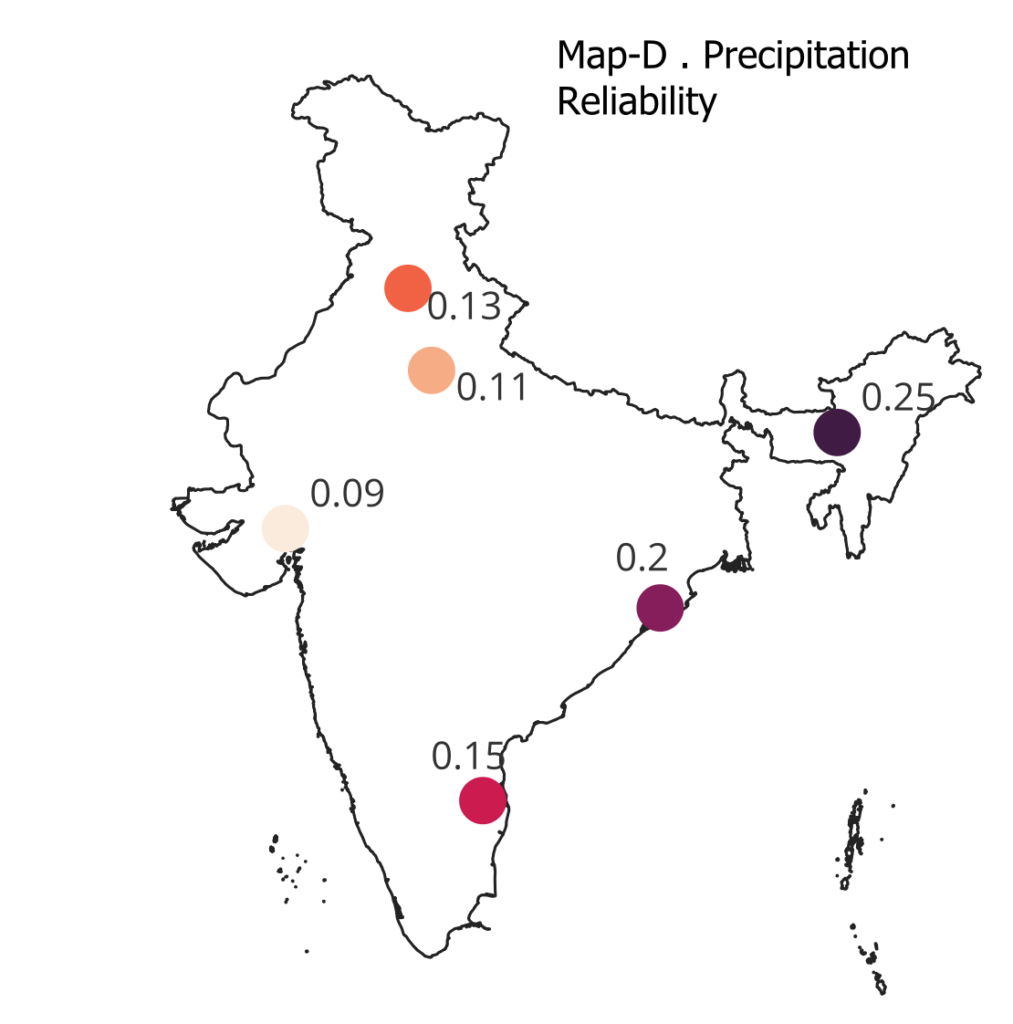
The map shows strong spatial contrast in water reliability across stations. GUWAHATI records the highest precipitation reliability (0.25), indicating dependable rainfall and lower structural water stress. BHUBANESWAR (0.20) and TIRUPATI (0.15) show moderate reliability, suggesting adequate but seasonally concentrated water availability. CHANDIGARH (0.13) and JEWAR / WESTERN UP (0.11) fall into a lower reliability zone, implying higher dependence on storage, recycling, and external water supply. AHMEDABAD shows the lowest precipitation reliability (0.09), highlighting chronic water scarcity and the highest pressure on engineered water infrastructure. overall, the map confirms a clear west–east gradient, with inland western locations facing the greatest water-security challenges for industrial operations.
E) The water scarcity index (WSI) measures structural water stress and is calculated as
WSI = 1 − precipitation reliability (PR).Higher values indicate greater dependence on engineered water supply, storage, and recycling, while lower values indicate better natural water availability.
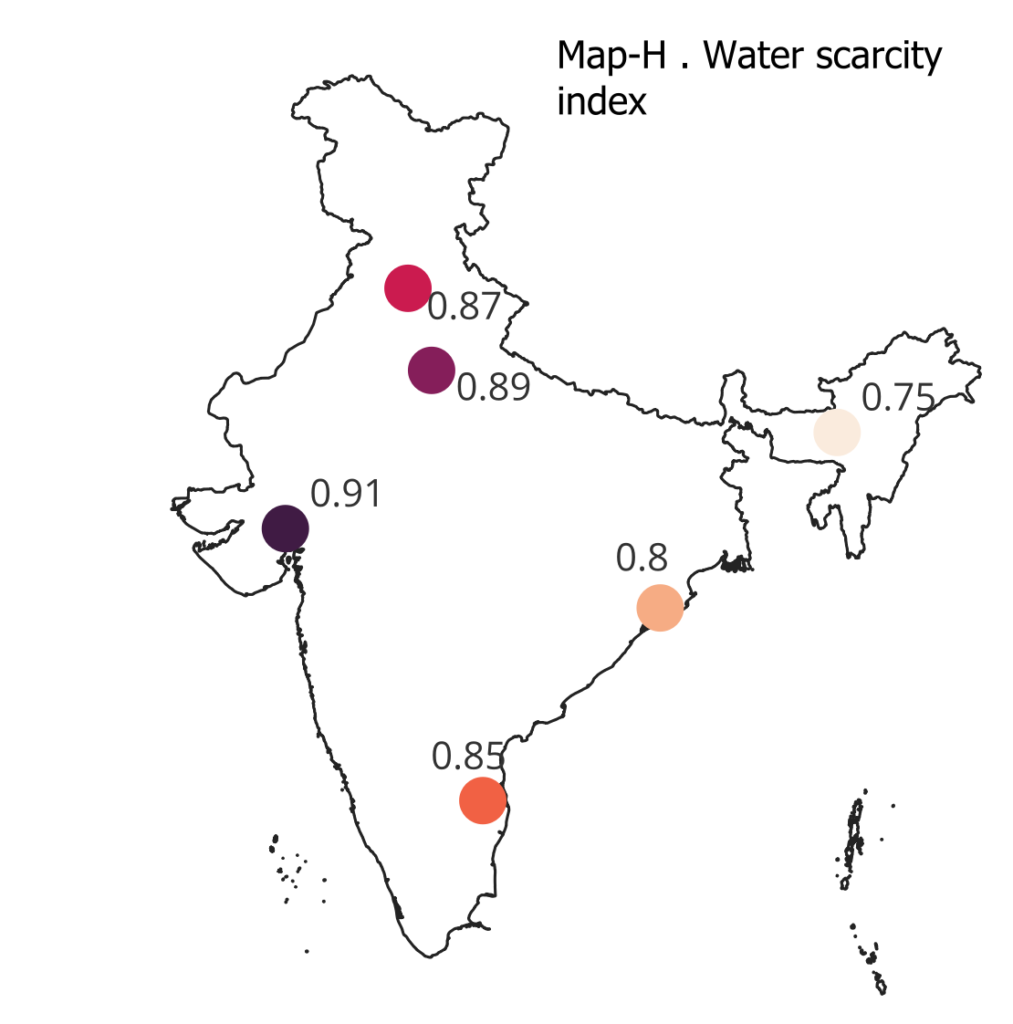
The map highlights strong spatial variation in water stress across india. AHMEDABAD shows the highest water scarcity (0.91), confirming severe and persistent water stress and heavy reliance on external water infrastructure. JEWAR / WESTERN UP (0.89) and CHANDIGARH (0.87) also experience high water scarcity, indicating significant pressure on groundwater extraction and recycling systems. TIRUPATI (0.85) represents moderately high scarcity, reflecting seasonal rainfall concentration rather than consistent availability. BHUBANESWAR (0.80) shows lower but still notable water stress. in contrast, GUWAHATI records the lowest WSI (0.75), indicating comparatively reliable natural water availability. Overall, the map demonstrates a clear west–east gradient, with inland and western locations facing the greatest water-security challenges for semiconductor operations.
F ) The Weather disruption index (WDI) represents the frequency of weather-related operational interruptions. it is calculated as the sum of annual fog days (FD) and thunder days (TD). higher values indicate greater risk of visibility loss, transport delays, power interruptions, and weather-induced downtime.
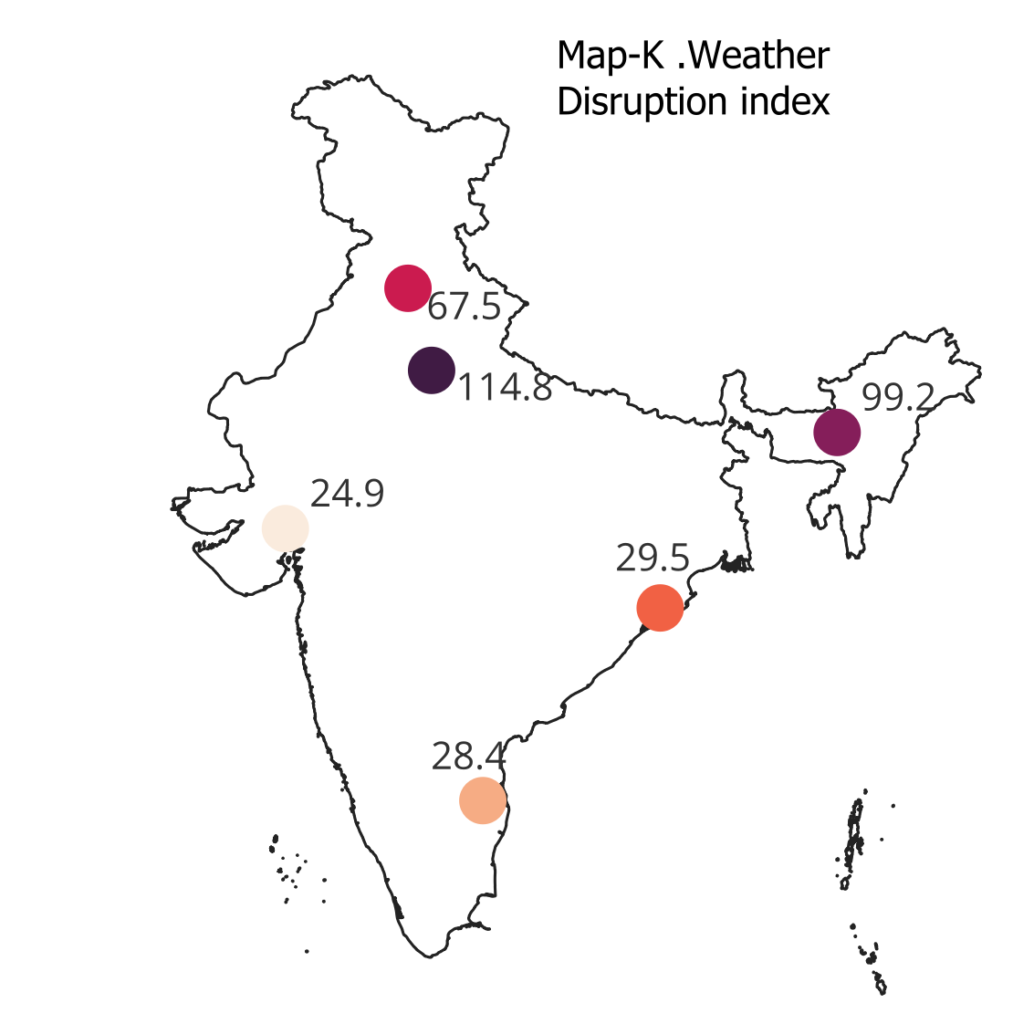
The map shows strong regional contrasts in operational disruption risk. JEWAR / WESTERN UP records the highest WDI (114.8), driven by very frequent fog and thunderstorms, making it the most disruption-prone location among the stations. GUWAHATI follows closely with a WDI of 99.2, reflecting intense convective activity and persistent fog. CHANDIGARH (67.5) shows moderate-to-high disruption risk, largely associated with winter fog events. in contrast, BHUBANESWAR (29.5), TIRUPATI (28.4), and especially AHMEDABAD (24.9) exhibit much lower disruption indices, indicating relatively stable operational conditions. overall, the map highlights that northern and northeastern locations face the greatest weather-related operational risks, independent of their thermal stress levels.
G ) The integrated climate cost index (TCCI) combines cooling energy demand, water scarcity, and weather-related disruption risk into a single composite indicator. it is calculated as a weighted sum of the total cooling load index (TCLI), water scarcity index (WSI), and weather disruption index (WDI), representing overall climate-driven operational cost pressure at a location.
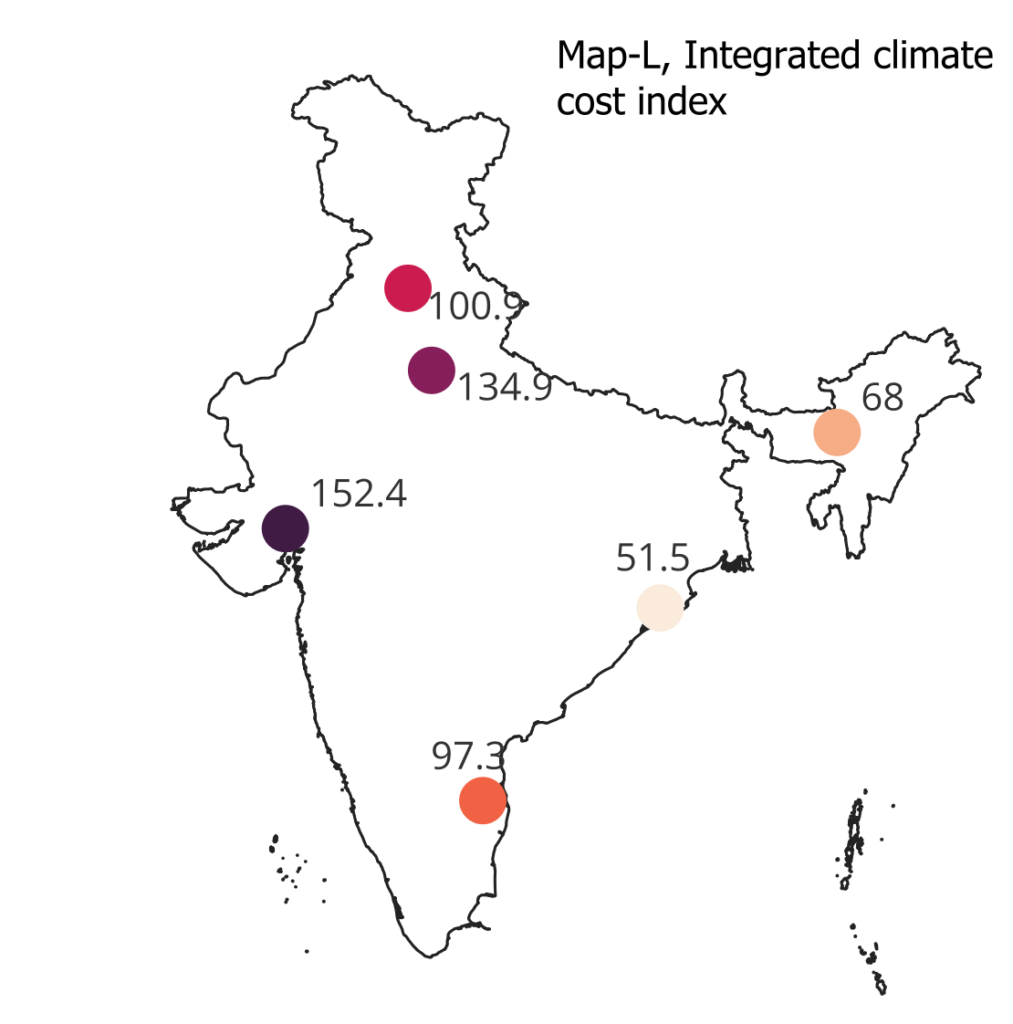
The map reveals clear spatial contrasts in overall climate-related cost burden. AHMEDABAD records the highest TCCI (152.4), reflecting the combined impact of extreme sensible cooling demand and severe water scarcity. JEWAR / WESTERN UP (134.9) also shows very high integrated cost due to strong cooling requirements coupled with exceptionally high weather disruption risk. CHANDIGARH (100.9) and TIRUPATI (97.3) occupy an intermediate position, where moderate cooling demand is amplified by either water stress or operational disruptions. GUWAHATI (68) and especially BHUBANESWAR (51.5) show substantially lower integrated climate costs, indicating more favourable overall climatic conditions despite humidity-related challenges. overall, the map demonstrates that total climate cost is not controlled by a single factor but emerges from the interaction of heat, water availability, and weather variability, with inland western and northern locations facing the greatest combined burden.
Conclusion
The analysis shows that climate plays a decisive role in shaping the operating cost and risk profile of semiconductor facilities in india. inland western and northern locations such as AHMEDABAD and JEWAR / WESTERN UP face the highest overall climate-related costs due to strong temperature-driven cooling demand, severe water scarcity, and in some cases high weather disruption. CHANDIGARH and TIRUPATI represent intermediate conditions, where moderate cooling stress is offset or amplified by local water and weather constraints. in contrast, BHUBANESWAR and GUWAHATI exhibit lower integrated climate costs, although their advantages in cooling and water availability are partly offset by high humidity and frequent weather disruptions. overall, the results highlight that no single climatic variable determines site suitability; instead, optimal semiconductor location decisions in india must balance cooling energy demand, water security, and operational reliability rather than relying on temperature alone.